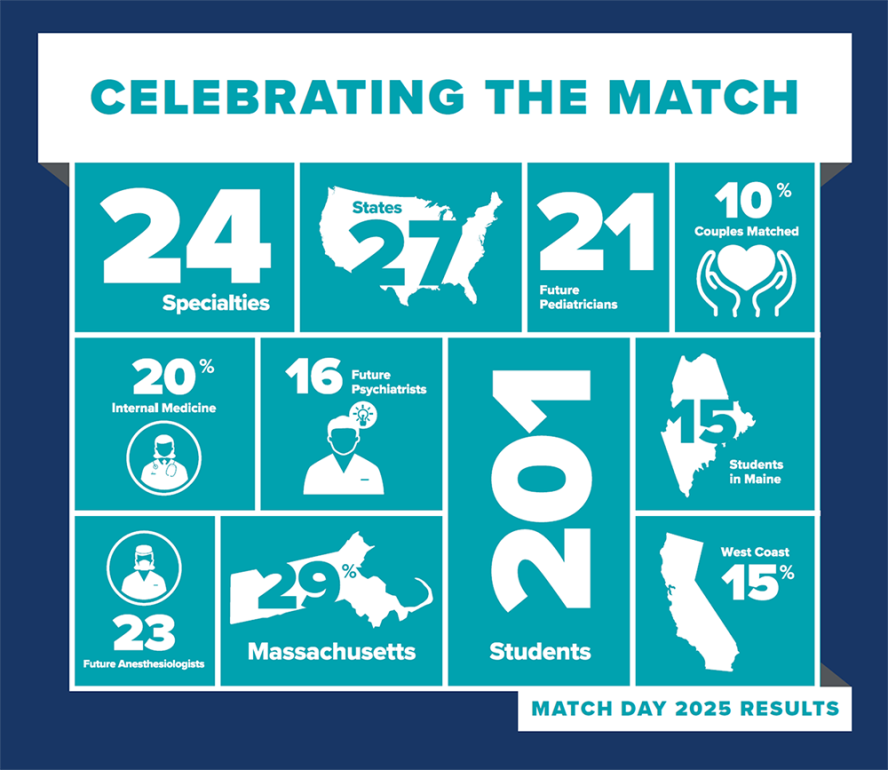
2025 Residency Match Data
| Entering into Residency Programs | 201 |
|---|
| Specialty | Students | Percent |
|---|
| Anesthesiology | 23 | 11% |
| Dermatology | 5 | 2% |
| Diagnostic Radiology | 8 | 4% |
| Emergency Medicine | 9 | 4% |
| *Family Medicine | 14 | 7% |
| ^General Surgery | 12 | 6% |
| *Internal Medicine | 35 | 17% |
| *Internal Medicine-Primary Care | 4 | 2% |
| Internal Medicine/Emergency Medicine | 1 | 0% |
| Internal Medicine/Pediatrics | 1 | 0% |
| Internal Medicine/Psychiatry | 1 | 0% |
| Neurology | 6 | 3% |
| Neurosurgery | 2 | 1% |
| ^Obstetrics/Gynecology | 14 | 7% |
| ^Ophthalmology | 4 | 2% |
| ^Orthopaedic Surgery | 7 | 3% |
| ^Otolaryngology | 2 | 1% |
| *Pediatrics | 21 | 10% |
| ^Plastic Surgery | 4 | 2% |
| Psychiatry | 14 | 7% |
| Psychiatry/Comb-Child | 1 | 0% |
| Radiation Oncology | 1 | 0% |
| ^Urology | 3 | 1% |
| ^Vascular Surgery | 1 | 0% |
| Preliminary Internship Year |
|---|
| Preliminary Medicine | 10 |
| ^Preliminary Surgery | 7 |
| Transitional Year | 8 |
| * Potential Primary Care | 74 | 37% |
| ^ All Surgical Specialties | 47 | 23% |
