DPT Cohort Demographic Profiles

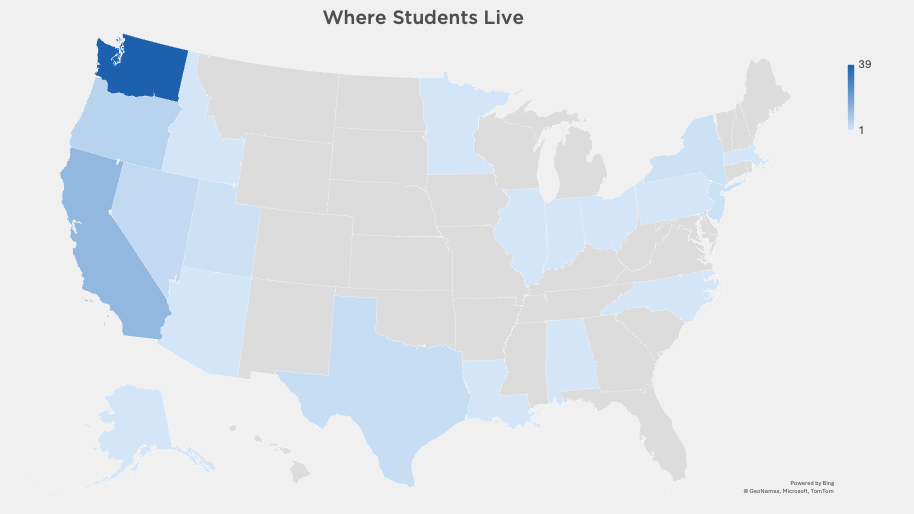
Below is the demographic information for our latest enrolling cohort, the Class of 2027. View insights into the diverse demographic backgrounds and experiences that shape our student community in Boston, Phoenix, and Seattle. Our programs attract a vibrant mix of individuals, fostering a collaborative learning environment that enhances both academic and clinical training.

Demographics

 BostonPhoenixSeattle
Total Matriculated955083
    
Hispanic111517
    
Race   
American Indian or Alaskan Native011
Asian15824
Black or African American1247
White633751
Native Hawaiian or Other Pacific Islander023

Age

 BostonPhoenixSeattle
Average252727
Min212222
Max504358

Gender

 BostonPhoenixSeattle
Male312532
Female642540
Non-Binary1

Socioeconomic & Background Factors

 BostonPhoenixSeattle
First generation college students201622
Families receiving public assistance251123
Federal Pell Grant eligible362023
Veterans204

Geographic Distribution of Our Student Body

  • Map showing where students live - DPT-Boston
    MA35
    NY10
    NJ8
    NH6
    VA5
    CA4
    IL4
    RI4
    CT3
    GA2
    MD2
    PA2
    CO1
    DE1
    FL1
    HI1
    KY1
    LA1
    ME1
    NC1
    NM1
    WA1
  •  

    Map showing where students live - DPT-Phoenix
    StateCount
    CA13
    AZ10
    TX8
    NM3
    FL2
    MI2
    UT2
    VA2
    AL1
    CO1
    HI1
    IL1
    IN1
    MS1
    PA1
    WA1
  • Map showing where students live - DPT-Seattle
    StateCount
    WA39
    CA13
    OR6
    NV4
    TX3
    NJ2
    NY2
    UT2
    AK1
    AL1
    AZ1
    ID1
    IL1
    IN1
    LA1
    MA1
    MN1
    NC1
    OH1
    PA1